
Process mapping is a visual record of who does a task, in what order, and why they do it that way instead of some other way. Follow this process mapping guide and you'll be able to build flowcharts, swimlane diagrams, or SIPOC charts that expose bottlenecks, cut onboarding time, and give a team a shared picture of work that used to live only in someone's head.
TL;DR:
- Process maps focus on showing workflow shape, decision points, and handoffs, making it easier to identify bottlenecks and improve efficiency across teams.
- The most effective maps match the format to the audience, with flowcharts, swimlanes, SIPOC, or value stream maps suited to different needs and levels of detail.
- Validating the map with frontline staff and prioritizing fixing high-impact, low-effort issues ensures your process improvement efforts are practical and sustainable.
- Keeping maps simple and regularly updated prevents them from becoming outdated, especially by attaching decision rationales and reviewing them on set cadences.
- Use collaboration tools with templates, version history, and export options to facilitate adoption and continuous improvement.
Table of Contents
- What Is Process Mapping and When Should You Use It?
- Which Type of Process Map Should You Use?
- What Symbols and Notation Should a Process Map Use?
- How to Map a Process Step by Step
- How Much Detail Should Your Process Map Include?
- How Do You Analyze a Map for Bottlenecks?
- What Tools and Templates Work Best for Getting Started?
- How Do You Keep Maps From Going Stale?
- What I'd Prioritize If I Were Starting From Scratch
- Capture the Decisions Behind Your Workflows With Kept
- Sources
- FAQ
What Is Process Mapping and When Should You Use It?
A process map is not the same thing as a procedure document. A procedure tells someone what to do. A map shows the shape of the work: the sequence, the decision points, the handoffs between people or systems. Academic research on diagrammatic process representations backs up something most operations leads already suspect from experience: visual representations improve comprehension and decision-making compared to a paragraph of instructions buried in a wiki page. A flowchart lets a new hire see, in five seconds, that step three loops back to step one under certain conditions. A written SOP buries that loop in the fourth sentence of the third paragraph.
Business teams reach for process mapping for a handful of recurring reasons:
- Process improvement: you suspect a workflow is slower than it should be, but nobody can point to exactly where.
- Onboarding: a new employee needs to learn a process that currently exists only as "ask Sarah."
- Automation prep: before you hand a workflow to an automation tool, you need to know every branch and exception it contains.
- Compliance and audit readiness: regulators or auditors want documented, repeatable steps, particularly in healthcare and financial services.
The trigger to start mapping is usually one of three signals: a process breaks in a way nobody can explain, a key person who "just knows how it works" is about to leave, or a team keeps asking the same clarifying question during handoffs. If you're hearing "wait, who's supposed to do that?" more than once a month, that process is overdue for a map.
Which Type of Process Map Should You Use?
Different jobs call for different formats, and picking the wrong one is the single fastest way to produce a map nobody looks at twice. A rule of thumb: match the map to the audience and the decision it needs to support, not to whichever template happened to load first.
- Basic flowchart: linear steps and decisions, best for a single-person or single-team process like an approval chain.
- Swimlane (cross-functional) diagram: organizes steps into lanes by role or department, ideal when a process crosses three or more teams and handoffs are the real problem.
- SIPOC: maps Suppliers, Inputs, Process, Outputs, and Customers at a high level, useful early in a project when you need to agree on scope before drawing a single arrow. Guides on process discovery consistently recommend SIPOC as a starting technique for exactly this reason.
- Value stream map: tracks the flow of material or information alongside time and waste metrics, common in manufacturing and lean operations work.
- BPMN diagram: a formal notation with strict symbol rules, best when the map needs to be read by both humans and software.
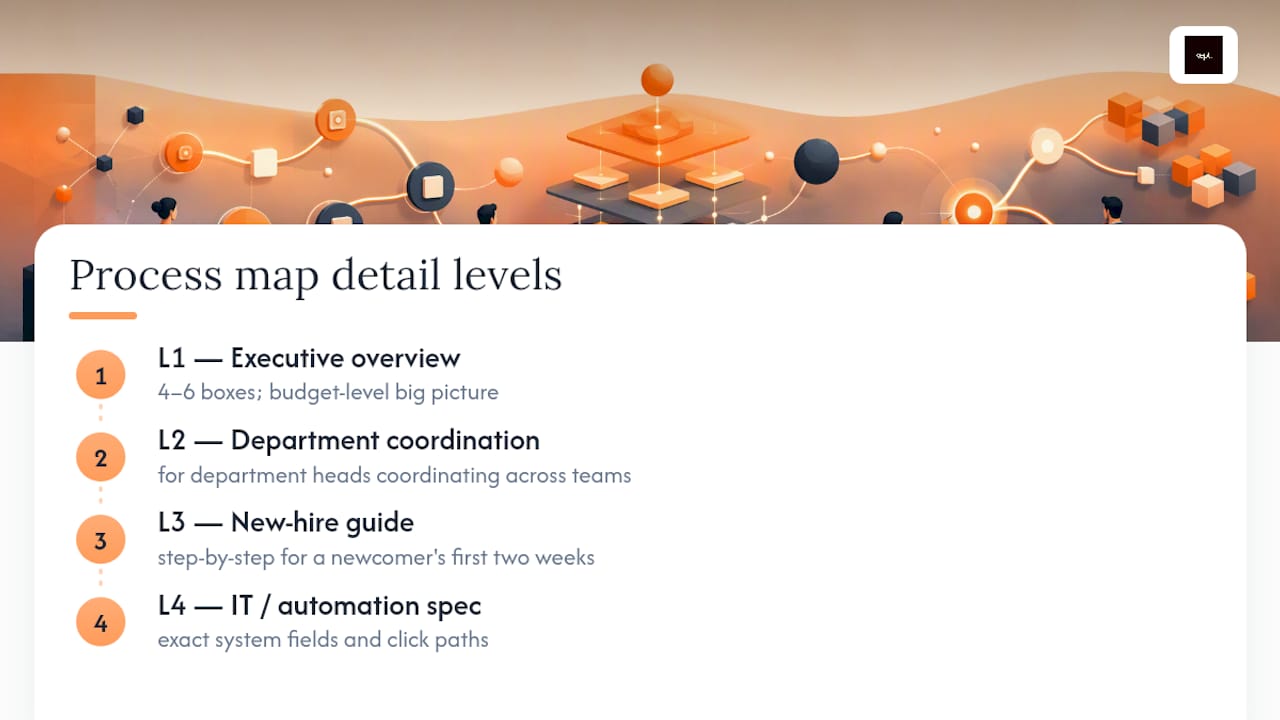
Layered on top of format is depth, often described in four levels. L1 is an executive summary, four or five boxes showing the whole process at a glance. L2 breaks that into the major sub-processes a manager would recognize. L3 gets into the step-by-step detail a frontline employee follows daily. L4 documents system-level actions, field names, and exact click paths, the level automation and IT teams need.
What Symbols and Notation Should a Process Map Use?
You don't need to be fluent in a formal standard to draw a map people can follow, but you do need consistency. A handful of shapes cover nearly every situation: a rounded rectangle or oval marks the start and end (terminal points), a rectangle marks a process step, a diamond marks a decision, and arrows show the direction of flow. Swimlanes are horizontal or vertical bands that assign each step to the role or system responsible for it.
Reach for BPMN when the map needs to survive contact with software, when it will be handed to a developer or an automation platform, or when multiple tools need to read the same diagram consistently. Bpmn maintains the standardized notation for exactly that handoff between people and machines. For an internal team map that a human will read and nobody else, simple shapes and clear labels beat formal notation every time.
The most common readability mistake is vague labeling: a box that says "review" instead of "manager reviews expense report for policy compliance." Name the actor and the action in every box, and keep arrows moving in one general direction, left to right or top to bottom, so nobody has to trace a spaghetti diagram to find the happy path.
How to Map a Process Step by Step
This is the part most guides skip past, and it's the part that decides whether your map gets used or gets forgotten in a shared drive. The method below comes from how mapping workshops actually run when the goal is adoption, not decoration.
-
Define the purpose, start point, and end point. Write one sentence: "This process starts when a customer submits a support ticket and ends when the ticket is closed." Attach a success metric now, before you draw anything: resolution time, error rate, cost per unit, whatever matters for this specific process.
-
Pick the mapping team. Include the people who actually do the work, not just their managers. A manager describes the process as designed. The person doing it daily describes the process as it actually runs, exceptions and workarounds included. Both perspectives matter, but the frontline view is the one most guides forget to prioritize.
-
List the steps before you draw anything. Get the group to call out every action in order, on sticky notes or in a shared doc. Resist the urge to open drawing software immediately. A list is faster to edit than a diagram.
-
Draw the main path first. Map the happy path, the version of the process that runs when nothing goes wrong. Process mapping literature consistently recommends starting with the primary path and iterating rather than trying to capture every branch on the first pass. Add decisions and exceptions in a second round, once the spine of the map is solid.
-
Validate the baseline map with the people who do the work. Walk it past the same frontline staff from step two and ask a direct question: "Is this what actually happens?" Practitioner guidance on process discovery treats this validation step as non-negotiable, because maps built without frontline review tend to reflect policy rather than reality. This is also where rework loops and edge cases surface, the ones nobody mentioned in the first interview.
-
Design the future state, prioritize fixes, and set KPIs. Once the baseline is accurate, draw a second version showing the process as it should run. Rank proposed fixes by how much friction they remove versus how hard they are to implement, and attach the same metric you defined in step one so you can prove the change worked.
Pro Tip: Run the validation walkthrough as a live session, not an email review. People catch missing steps out loud, in conversation, far more often than they catch them reading a static diagram alone at their desk.
How Much Detail Should Your Process Map Include?
Matching detail to audience is where most maps go wrong, usually in the direction of too much. An L1 map, four to six boxes, belongs in front of executives who need the big picture for a budget decision. L2 serves department heads coordinating across teams. L3, the step-by-step version, is what a new hire follows during their first two weeks on the job. L4 documents exact system fields and click paths, and it exists almost exclusively for IT and automation teams building against the process.
A practical heuristic: stop adding detail the moment the map stops helping the person who has to use it. If a manager glancing at an L1 map starts asking about field-level system behavior, you've either handed them the wrong level or you're about to over-build one map to serve two audiences that need two separate documents.
Over-detailed maps carry a real maintenance cost. Every extra box is another thing that goes stale the next time the software changes or a policy shifts. A lean L2 map that gets updated twice a year beats an exhaustive L4 map nobody dares touch because nobody remembers how it was built.
How Do You Analyze a Map for Bottlenecks?
A finished map is a diagnostic tool, not a finish line. Certain visual patterns point directly at problems:
- A handoff with no clear owner on either side usually means work sits waiting for someone to notice it.
- A loop back to an earlier step signals rework, often from a quality check that catches errors too late in the process.
- A cluster of decision diamonds in one area suggests decision overload, a spot where one person is making judgment calls that could be simplified into rules.
Attach real numbers to the map wherever you can: cycle time per step, throughput per day or week, and error rate at each handoff. Project Management Institute research on disciplined process practices ties this kind of measurement directly to organizational performance, finding that organizations investing in process and project discipline report measurably better outcomes and more predictable delivery. Once you have numbers, prioritize fixes with a simple impact-versus-effort lens. A quick win is high impact, low effort, like eliminating a redundant approval step that adds two days but no actual risk control.
What Tools and Templates Work Best for Getting Started?
The tool matters less than the habit of finishing what you start, but a handful of features separate a workable tool from a frustrating one. Marketplace reviews of mapping software consistently point to collaboration, templates, and version history as the features teams actually rely on day to day, alongside export options and permission controls that keep sensitive processes visible only to the right people.
A short checklist before you commit to any platform:
- Real-time collaboration, so a workshop group can edit the same map together.
- Version history, so you can roll back after an edit that turns out to be wrong.
- Prebuilt templates for flowcharts, swimlanes, and SIPOC, so you're not building shapes from scratch.
- Export formats that match what your team actually needs, PDF for a stakeholder review, image files for a wiki page.
Start small. Take a single flowchart template and adapt it for your most painful process, run it as a pilot with one team, and only then decide whether swimlanes or SIPOC fit better for the next process on your list. A pilot map that gets used beats a perfect map that gets shelved.
How Do You Keep Maps From Going Stale?
A process map documents the sequence of steps. It rarely captures why a step exists, what exception the last person on the job learned to handle, or which shortcut a senior team member quietly relies on. That reasoning is the part organizations lose fastest when someone changes roles or leaves, and it's the gap that turns a technically accurate map into one that still leaves new hires confused.
Capturing that logic doesn't require a heavier documentation process. Attaching short notes on decision rationale directly to map steps preserves the "why" behind a judgment call in a way a diagram alone never will. Engineering teams onboarding new hires face this constantly: the map shows the deployment sequence, but the reasoning behind a specific exception lives in one senior engineer's head until someone captures it deliberately.

Governance doesn't need to be heavy either. Assign one owner per map, set a review cadence (quarterly for high-change processes, annually for stable ones), and treat any process change as a trigger to update the map the same week, not the next audit cycle.
What I'd Prioritize If I Were Starting From Scratch
Most mapping efforts fail from over-detailing the first draft, skipping validation with the people doing the work, or ignoring handoffs entirely in favor of documenting individual tasks. My advice: run a small pilot on your single most painful process, validate it out loud with frontline staff, and resist adding a fourth level of detail until the first three levels are actually being used. Map the one or two processes causing the most pain before you touch anything else.
— Anthony
Capture the Decisions Behind Your Workflows With Kept
A process map shows you the steps. It rarely shows you why someone deviates from step four when a client calls with an unusual request, and that reasoning is exactly what walks out the door when an employee changes roles. Kept fills that gap by letting people describe their own workflows in conversation, then structuring those verbal walkthroughs into documentation that includes the exceptions and judgment calls a diagram alone leaves out.
Some teams have processes that exist mostly in someone's head, experience long onboarding timelines due to tribal knowledge, or face challenges when a recent departure exposes how much context leaves with one person. HR teams often seek to standardize onboarding across departments, and operations teams aim to keep the reasoning behind a workflow attached to the map itself rather than scattered across old emails and chat threads. If your team already has process maps but keeps losing the "why" behind them, visit Kept for Business to see how conversational capture works for a team your size, or check the upcoming live session to watch the process in action before committing to anything.
Sources
- Bpmn
- PMI — Pulse of the Profession (press release)
- ACM proceedings paper on diagrammatic process representations
FAQ
What Are L1, L2, L3, and L4 Process Levels?
L1 is a high-level executive view with four to six steps, L2 breaks that into major sub-processes, L3 documents step-by-step detail for frontline staff, and L4 captures system-level actions for IT and automation teams.
What Are the Four Levels of Process Mapping?
The four levels, L1 through L4, move from a broad executive overview down to granular, system-specific detail, with each level matched to a different audience's needs.
What Should a Process Map Include?
A complete process map needs a clear start and end point, every step in sequence, decision points, the role or system responsible for each step, and labels specific enough that a new reader understands the action without asking a follow-up question.
What Are the Basic Steps for Building a Flowchart?
Define the process purpose and boundaries, gather the people who do the work, list every step before drawing, map the main path first, add decisions and exceptions, validate with frontline staff, and revise based on their feedback.
How Does Process Mapping Fit Into Broader BPM Work?
Process mapping is the visual foundation of business process management. Once a map exists, BPM practices use it to analyze performance, automate where it makes sense, and track improvements against the metrics defined during the mapping stage.